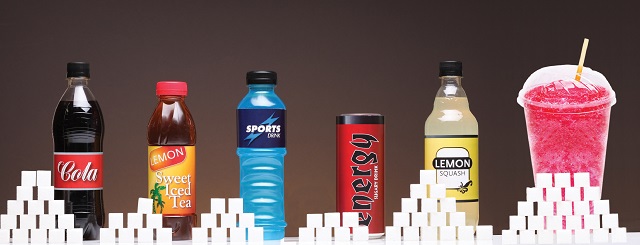
Here are some suggestions to help you, your school or your workplace, go sugar sweetened beverage free.
For workplaces
- Want to help your staff and colleagues reduce their sugary drink consumption? Download the free Rethink Sugary Drinks e-kit for workplaces.
- Is there a vending machine in your building? Time to take an audit of its contents. If you can't get rid of the machine altogether, lobby to get it stocked with water or unsweetened drinks. Download the Healthy Drinks Vending Machine Guidelines.
- Look at your catering, do you provide sugary soft drinks at functions or meetings? It might be time to consider other options.
- Ensure you provide tap water or a water cooler that employees can easily access.
- Spread the word about the health effects of regular sugary drink consumption:
- For more tips download the Rethink Sugary Drink at Work fact sheet
For schools
- Review your canteen menu and vending machine contents and remove any high sugar content soft drinks. This includes energy drinks, sports drinks, cordials and flavoured mineral waters with high sugar content. Replace them with reduced-fat milk drinks or water. Download the Healthy Drinks Vending Machine Guidelines.
- Look at the price of your low-sugar options, could you make them more appealing?
- Make sure you have plenty of drinking taps and encourage children/students to use them regularly throughout the day, especially during the warmer months.
- Encourage children/students to bring their own water bottle to school and refill throughout the day.
- Download the Rethink Sugary Drink at School fact sheet
- Educate students about the health impacts associated with sugar drinks with the Rethink Sugary Drink Critics’ Choice. It includes a free downloadable teacher resource that aligns with the Australian Curriculum: Health and Physical Education for Years 5 to 10.
For parents
- With fruit juices, look on the packaging and make sure there is no added sugar.
- Don't add anything to milk. If your child is aged over two, serve them low-fat milk.
- If you are in a fast food outlet ask to replace the default sugar sweetened beverage with water.
- Give your child a water bottle to take to school that they can refill throughout the day.
- Speak to the school if it serves sugar sweetened drinks in vending machines and at the canteen to ask them to remove them.
- When other people look after your child, such as grandparents or babysitters, ask them to give your children low-fat milk or water rather than other drinks.
- Download the Rethink Sugary Drink at Home fact sheet
For sport and recreation centres
Vending machines
If your school or workplace has a vending machine, the healthiest step would be to remove it. The next best alternative would be to only stock it with water, reduced or low fat milk and low-kilojoule options. Download our Healthy Drinks Vending Machine Guidelines for more tips.
Tips to help you cut back
- Find out how much sugar is in your favourite drink.
- If you're ordering a fast food meal, don't go with the default regular/sugar soft drink, see what other options there are. For kids, see what else is on offer, or just ask for water.
- Carry a water bottle, so you don't have to buy a drink if you're thirsty.
- If you're thirsty, have some water first.
- Be wary of any health or nutrition claims on the drinks you buy. Many producers are now trying to make their sugar sweetened beverages sound healthier than they actually are. Refer to the amount of sugar on the nutrition panel if in doubt and consider the size of the bottle as well.
- If you consume sugary alcoholic drinks, see if there are lower sugar options. Even alcohol alone is loaded with kilojoules so cutting back on the booze is also good.
- Try to avoid going down the soft drink aisle at the supermarket and beware of the specials at the checkout and the service station.
